The current drought experienced by Cape Town and surrounds has brought the issue of climate change to the fore in public discourse (if it wasn’t already). It’s discussed extensively in the media and plays a prominent role in the City’s Water Outlook 2018 Report (Version 25 - updated 20 May 2018) as motivation for the need for long term bulk water augmentation schemes.
Somewhat bizarrely, another major global change factor that has significant impact on our water security, and that we can actually do something about in the short term, has received less attention - that of invasive alien plants. I’ve posted about this before and highlighted the issue in the press, but thought perhaps the most effective means to illustrate its importance is through a direct comparison of current and projected impacts on water yields - i.e. set up an Alien VS Climate Change celebrity deathmatch.
The Playing Field
This post relies on a number of data sources, mostly at the scale of the quarternary catchments as these are a standard unit used for hydrological research in the country. Unfortunately, they do not perfectly match the catchments that feed the dams in the Western Cape Water Supply System (WCWSS), because the dams are often positioned somewhere in a quarternary catchment, rather than at the outlet. Since I do not have the time or experitise to redo all the primary analyses, I figured easiest just to use quarternaries around the “Big Six” dams for Cape Town - excluding Steenbras since there’s no data for alien impacts in its catchment. If you don’t understand what I’m on about, never fear. The point I’m trying to make is that the figures I report below are not the exact figures for the catchments that supply the WCWSS, although they are likely to be very similar.
Here’s a map of the catchments I’ve used for context.
Climate Change
Ok, now for a quick look at the projected changes in rainfall as a proportion of the annual average. I present an ensemble of 11 Global Circulation Models (GCMs), because the models are constructed in different ways and help represent some of the uncertainty. I present only the worst-case scenario (see details below) to give Climate Change a fighting chance (although I think you already know the outcome…).
The details for those interested:
GCM outputs are from the Coupled Model Intercomparison Project Phase 5 (CMIP5). I present projections for the periods 2046 - 2065 and 2081 - 2100 under the worst greenhouse gas concentration trajectory, Representative Concentration Pathway 8.5.
Since I wanted to look at change in rainfall in the catchment areas and model outputs are typically at 2 to 3 degree spatial resolution (or ~ 222 - 333 km at the equator) I used data downscaled to the region by Wilson et al. 2015 - see paper for methods and links to data. This may not be the best data, but I like the methods and the baseline they used. I’m happy to try other data - if you provide them on a hard drive…
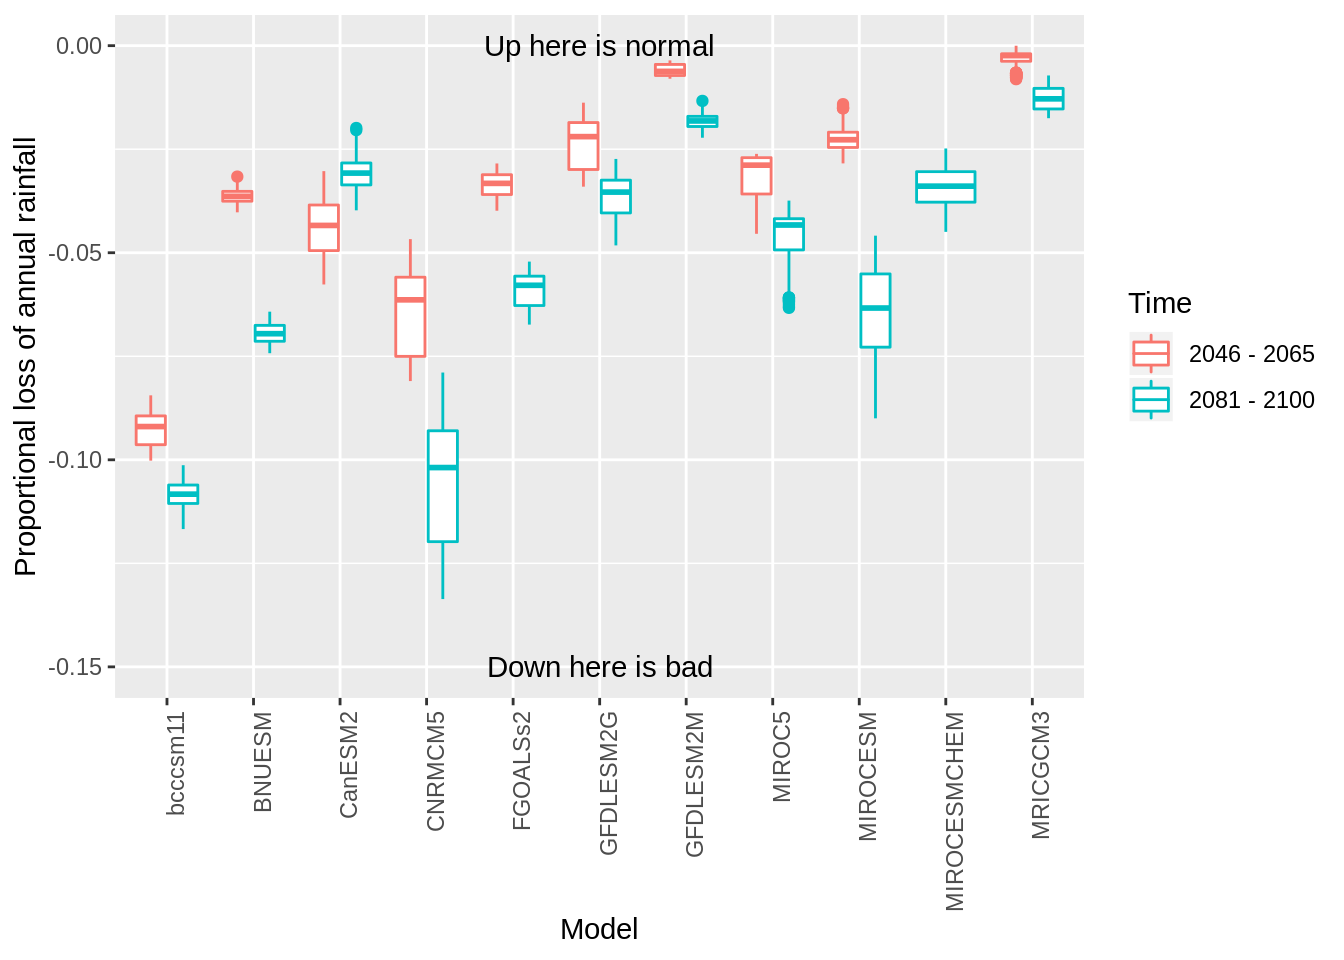
This represents an average reduction (multi-model ensemble mean) in rainfall by a factor of -0.032 across the entire catchment area by 2046 - 2065, with the range of means spanning -0.093, 0.008, and a reduction factor of -0.053 across the entire catchment area by 2081 - 2100 (range of means spanning -0.109, -0.013). The higher end of this - loss of ~10% of runoff - is a lot of water! But that’s not all!
One deficiency of presenting change in rainfall is that its difficult to translate that into an estimate of change in runoff. For example, one would have to estimate the losses to evapotranspiration - which are huge, and directly affected by changes in air temperature - which by 2081 - 2100 are projected to be significantly higher. It seems the standard in South Africa is to calculate runoff using the Pitman model, but that seemed like quite a learning curve for a simple blog post.
A quick and nasty way to get a feel for the relationship between runoff and rainfall in our catchments of interest is to compare existing estimates for the baseline. Here I plot the “naturalized” mean annual runoff (i.e. pre any land cover change) from Middleton and Bailey 2008 against the mean annual precipitation from the Schulze (2007). South African Atlas of Climatology and Agrohydrology.
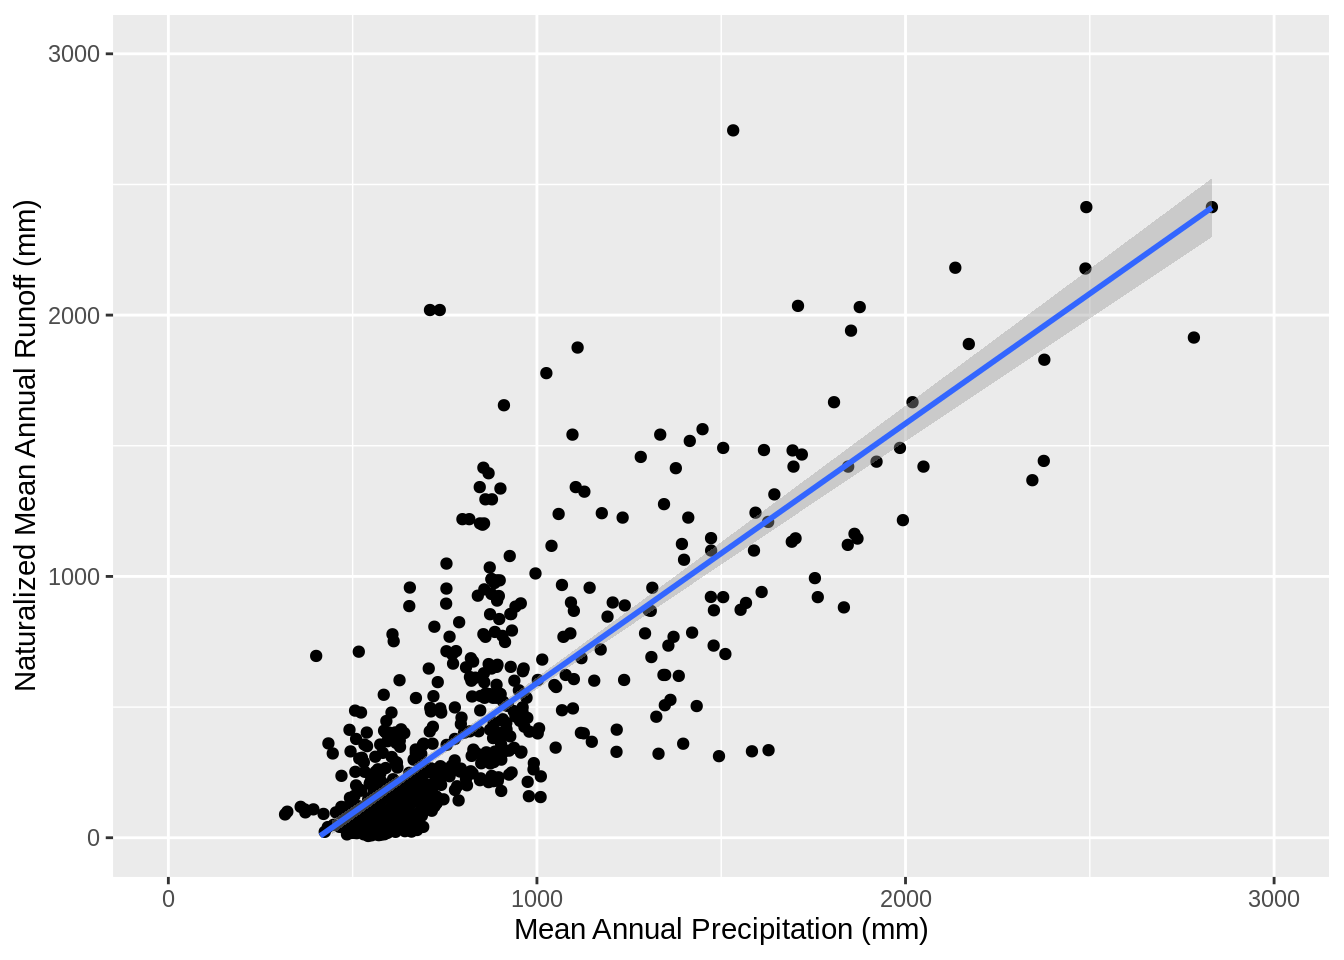
A bit messy, but there’s a pretty strong relationship. This suggests there’s next to no runoff in areas with <400mm, but above that the relationship is almost 1:1 (the slope is 0.994) - so our proportional reduction in runoff will be very similar to the rainfall.
To back this up, the City’s Water Outlook 2018 Report (Version 25 - updated 20 May 2018) includes this statement:
“A 2015 study (…) concluded that the majority of climate scenarios for the Western Cape indicate a drying with the change in runoff by 2050 of between -2% and -17%. A reduction of 15% in the mean annual run-off would result in a reduction in the Western Cape Town System yield of around 160 million litres per day (MLD) by 2050.”
I couldn’t work out what the original reference is (or what the “Western Cape Town System” is?), but let’s use the City’s more alarming figures - a reduction of between 2 and 17% - and apply them to our focal catchments to get a MLD figure for comparison with impacts from aliens.
Based on the estimate of “naturalized runoff” (i.e. pre any land cover change) from Middleton and Bailey 2008, this turns out to be a loss of 45.47 to 386.49 MLD by 2050.
Aliens
As I mentioned earlier, I’ve posted about this before. Based on the same data from Le Maitre et al. 2016. Estimates of the impacts of invasive alien plants on water flows in South Africa. Water SA Vol. 42 No. 4, the average annual reduction in runoff due to invasive alien plants for the same catchments was 222.59 MLD in 2008 - i.e. a factor of 0.098.
Note that this was as of 10 years ago!!! To make matters worse, Le Maitre et al. 2016 provide several good reasons why their estimates are conservative (estimates from previous research by Versfeld et al. 1998 were twice as high), and CapeNature report that as of 2017 the state of invasion in the catchments for Theewaterskloof Dam were 33% worse than the 2008 estimate, with the catchment for the Berg River Dam being similar. But let’s not get hung up over semantics.
And the winner is?
We now have some basis for comparison - Climate Change leads with a maximum of 386.49 MLD to Aliens’ 222.59 MLD.
But hang on, the estimate for Team Climate Change was for 2050. Aliens still have 42 years to make up the 163.9 MLD deficit…
Fortunately, Gorgens et al. 2016 have already calculated an estimate of the impact of aliens on the WCWSS by 2045 (close enough) to be 130 million m3/a if the clearing of IAPs were to be halted. The negative impacts of IAPs on the total yield of the WCWSS were about 38 million m3/a for the 2008 (“Baseline”") invasions. If we apply that ratio of 130:38 to our 2008 estimate we get a figure for 2045 of 761.5 MLD - roughly a third of the total runoff of these catchments under natural conditions!!!
Let’s summarise all these numbers visually.
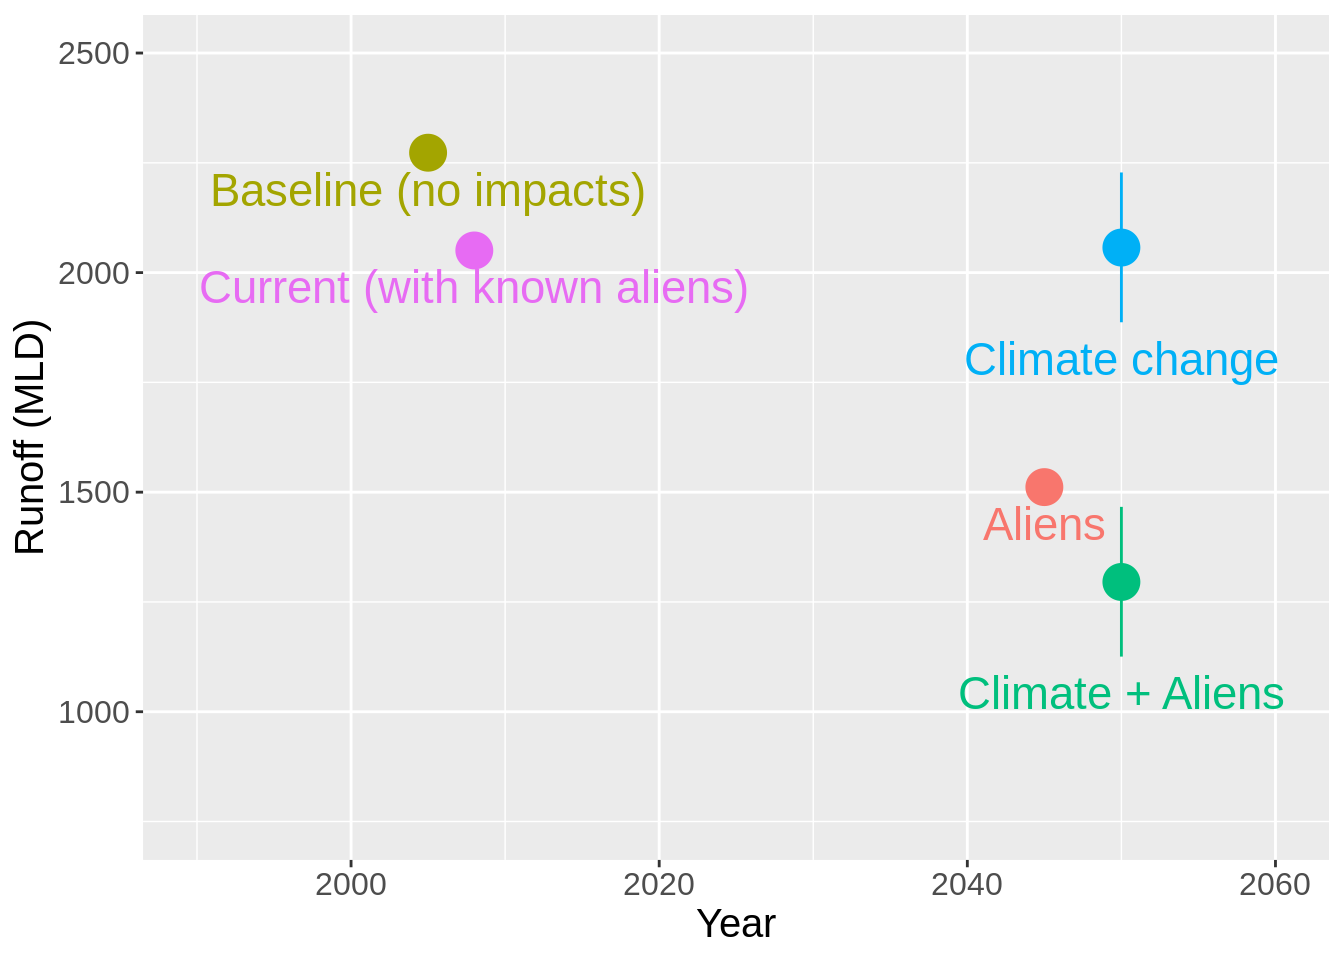
Here I’ve shown the known and estimated impacts chronologically relative to the estimated baseline average runoff assuming natural vegetation (Middleton and Bailey 2008). Note that “current” is as of 2008, and that alien impacts at this time were already greater than the mean estimated impact of climate change by 2050. Alien vegetation clearly has a much bigger impact on the water resources for the City of Cape Town and surrounds than climate change!!!
Conclusion
These stats are not perfect. There are many improvements that can be made and models that can be run. But even if my figures are far off the mark its unlikely that climate change stands a fighting chance. Unfortunately, as was the case for Alien VS Predator, the sad truth is that
“WHOEVER WINS… WE LOSE”
While climate change is a tricky challenge to address beyond lowering our emmissions and planning for an uncertain future, invasive alien plants are an issue we can do something about, with great returns in the short, medium and long term. We know what is needed to address the issue, and the consequences of inaction. We just need the powers that be to commit the appropriate resources.
I’ve discussed this elsewhere, but I’ll reiterate a few key points:
The City of Cape Town’s budget for augmentation schemes clearly indicates that they have the financial resources to clear aliens from our catchments
Restoring our catchments provides water at a lower cost than any of the augmentation schemes and has a multitude of associated benefits
If we do not clear aliens from our catchments they will continue to reduce our the recharge of groundwater and our dams
Developing dependence on groundwater without addressing the greatest threat to the resource is lighting the fuse on a time bomb
It’s a no brainer…
Further reading
Apologies. Not all of these are open access, but try googling the titles for free versions if the links don’t work for you… Also feel free to suggest references I should add.
Nel et al. 2014. Natural Hazards in a Changing World: A Case for Ecosystem-Based Management. PLoS One 9(5): e95942. - found that the uncontrolled spread of invasive alien trees halved the monthly flows experienced during extremely dry periods, and doubled fire intensities.
Kusangaya et al. 2014. Impacts of climate change on water resources in southern Africa: A review. Physics and Chemistry of the Earth 67–69 (2014) 47–54 - as the title suggests, but mostly highlighting uncertainties and research gaps.
Schulze, R. 2000. Modelling Hydrological Responses to Land Use and Climate Change: A Southern African Perspective. AMBIO: A Journal of the Human Environment 29(1):12-22. - a perspective piece discussing nine hydrological issues relating to land use and climate change, with examples.
Warburton et al. 2011. Hydrological impacts of land use change in three diverse South African catchments. Journal of Hydrology 414–415 (2012) 118–135 - explores the impacts of land use on catchment hydrology and the various complexities.