This is an updated quick and dirty analysis of the CapeNature fire database (spanning 1927 to 2018) to see if the major drought that is currently being experienced in the Cape Floristic Region has had any impact on the occurrence or extent of wildfires. I first ran this analysis in 2017 and have been updating it every year.
Wildfires are an essential component of fynbos, but components of the fire regime such as return interval need to be within certain bounds of variability to maintain healthy ecosystems. Too frequent fire and many species do not get time to reproduce, too infrequent fire and plants senesce and/or are invaded by thicket and forest species, eventually excluding fire (see post on Humans and forests in a changing sea of fire). Another concern is that the weather conditions in the first year or so after fire can have a big impact on community composition and the postfire recovery trajectory. In a recent long-term study, some co-authors and I have shown that sites where fires were followed by summers with extreme hot and dry weather showed a significant decline in species diversity. Unfortunately, these extremes are becoming more frequent and intense. I may follow this post up with an analysis of the interaction between fire and postfire weather to highlight areas that have already suffered abnormal extremes, but don’t hold your breath…
Note that I can make no guarantees of the accuracy of the fire data. In fact, it is safe to assume that they are far from perfect as the technologies available and the interest in and capacity for mapping fire scars has grown through time. Fire scars are predominantly mapped so that reserve managers know the age of the vegetation, and thus fuel load and fire risk, and there is little incentive to invest time in improving the older records when there are other more pressing issues to deal with. I’ve excluded all reserves that have no data prior to 1980, and have indicated 1980 on the plots as a suggested date from which we could possibly have more confidence in the data, but this is entirely my own assumption…
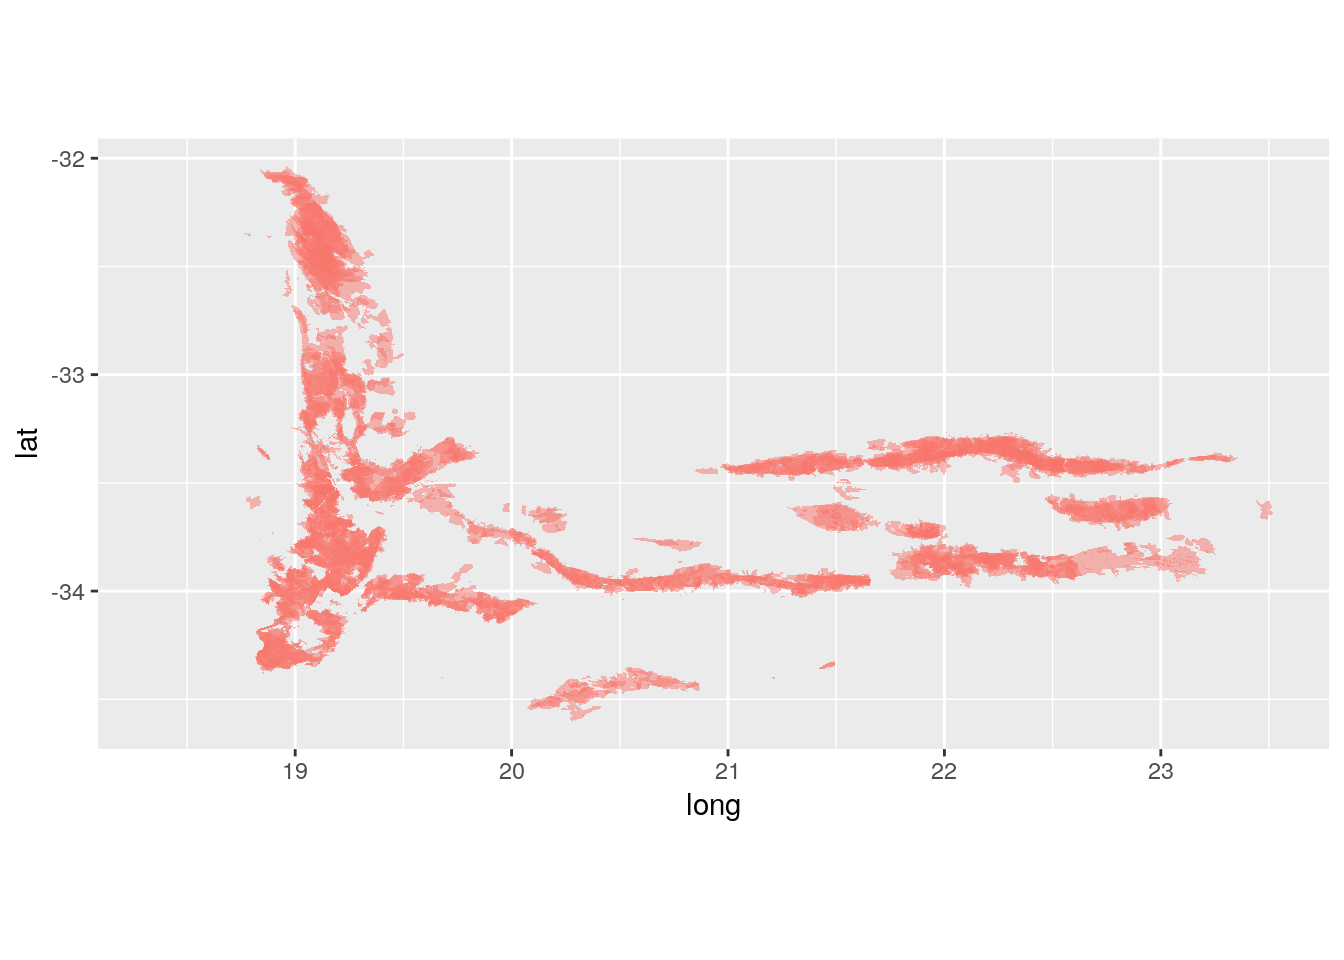
Here’s a map of all fires in the record. They essentially cover most of the mountainous regions of the Cape.
Now let’s look at the number of fires through time. Note that I have split fires into Winter (April to October) vs Summer (November to March) fires. Given that the Austral summer spans the change in calendar year I have labeled each summer based on the start year, e.g. the 2017/2018 fire season is labelled as the summer of 2017. Also note that the record ends in the winter of 2018 as data for the summer of 2018/2019 are still being compiled.
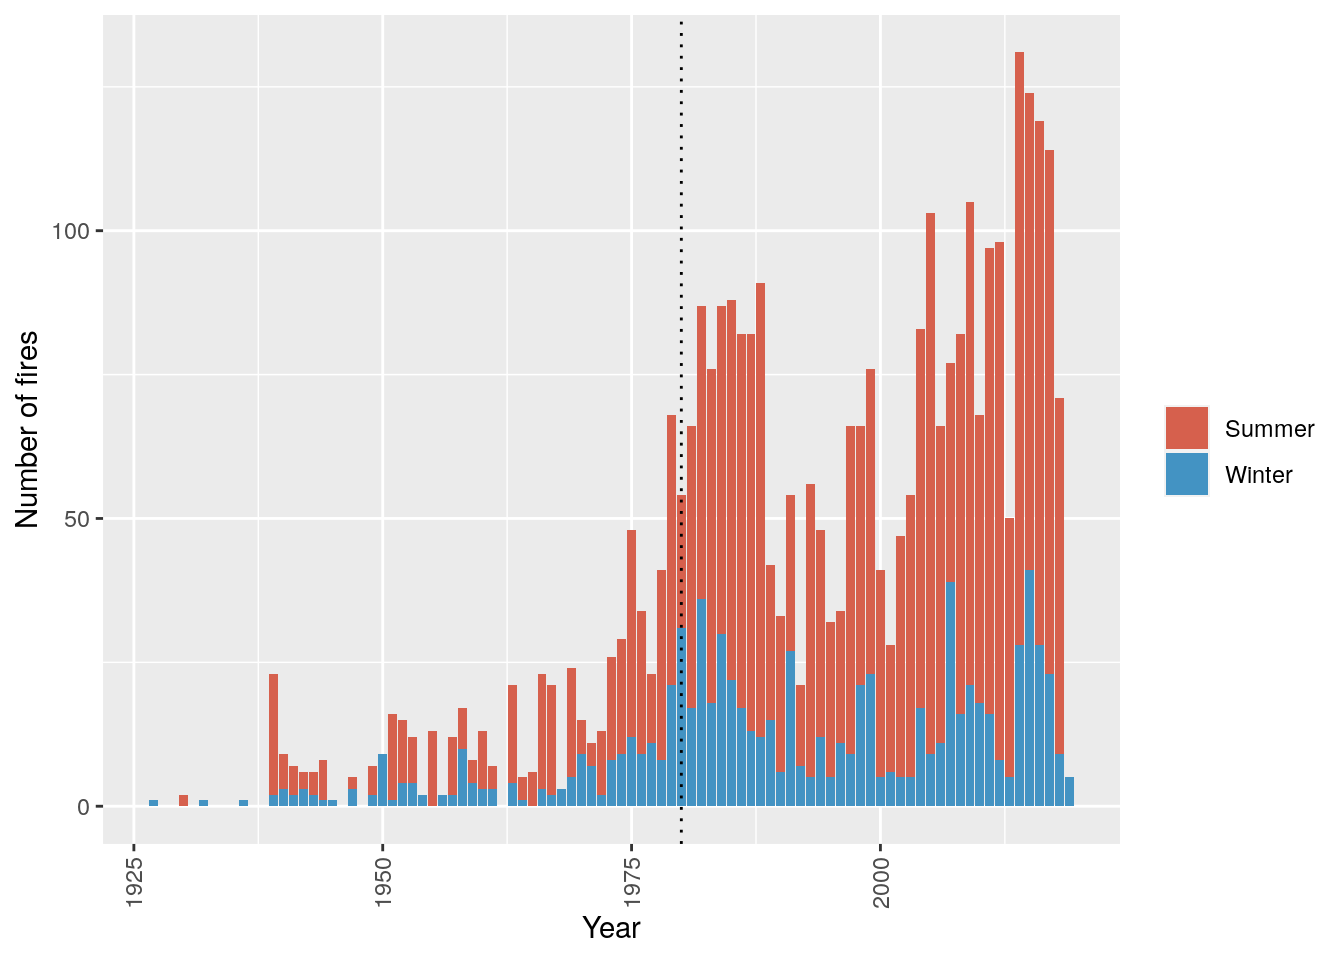
Lots more fires in the last few years, with 2015-2018 being the highest on record. Note that there may be many many small fires (e.g. due to arson) that are easily put out. A better reflection is burnt area as this integrates ignition frequency with the state (i.e. moisture content) of the fuel (i.e. vegetation) and the weather at the time of the fire.
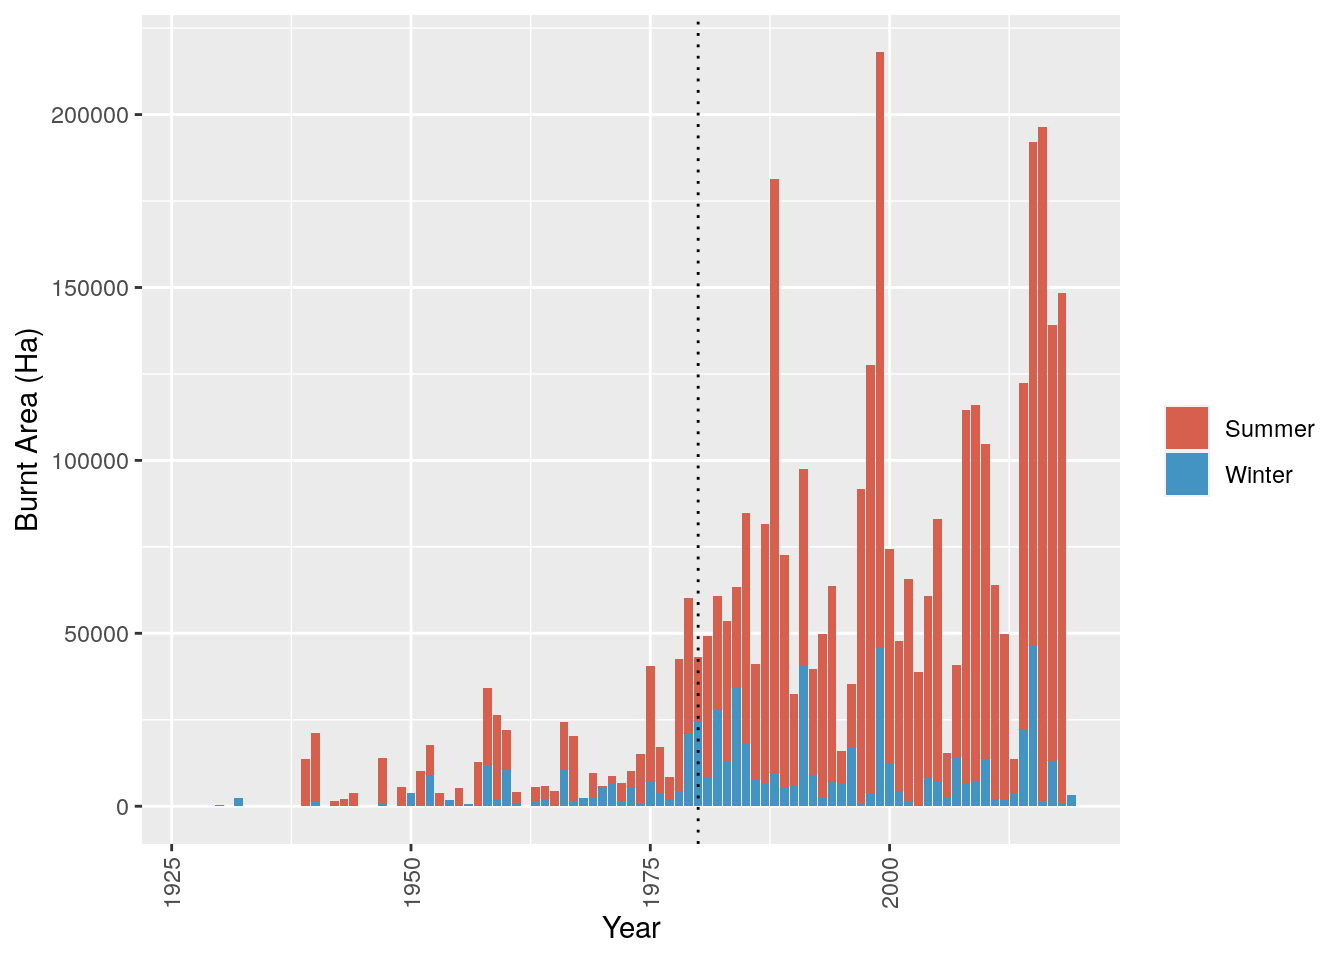
Still lots more burnt area in the past few years, but interestingly the 1988/1989, 1999/2000, 2015/2016 and 2016/2017 fire seasons stand head and shoulders above the rest. There are some curiously low years too (e.g. 1995/1996, 2006/2007, 2013/2014).
What determined the years with particularly high vs particularly low numbers of fires and burnt area? It looks like I may well have to get stuck into the weather data, but it is likely to be much more complicated than that. A hot, dry year may bear many fires and large burnt areas, but this is not sustainable, because after a few years of these conditions there is less to be burnt. This may be evident in the drop in number of fires and burnt area in the last two fire seasons. Similarly, one would assume that the accumulation of vegetation biomass is slower in hot, dry years, further reducing the probability of fires in subsequent years. One alternative hypothesis (and there are many) is that frequent fires and hotter, drier weather may shift the system to a grassier state, resulting in more frequent, but less intense fires. Some interesting further reading available here, but still lots of science to be done!
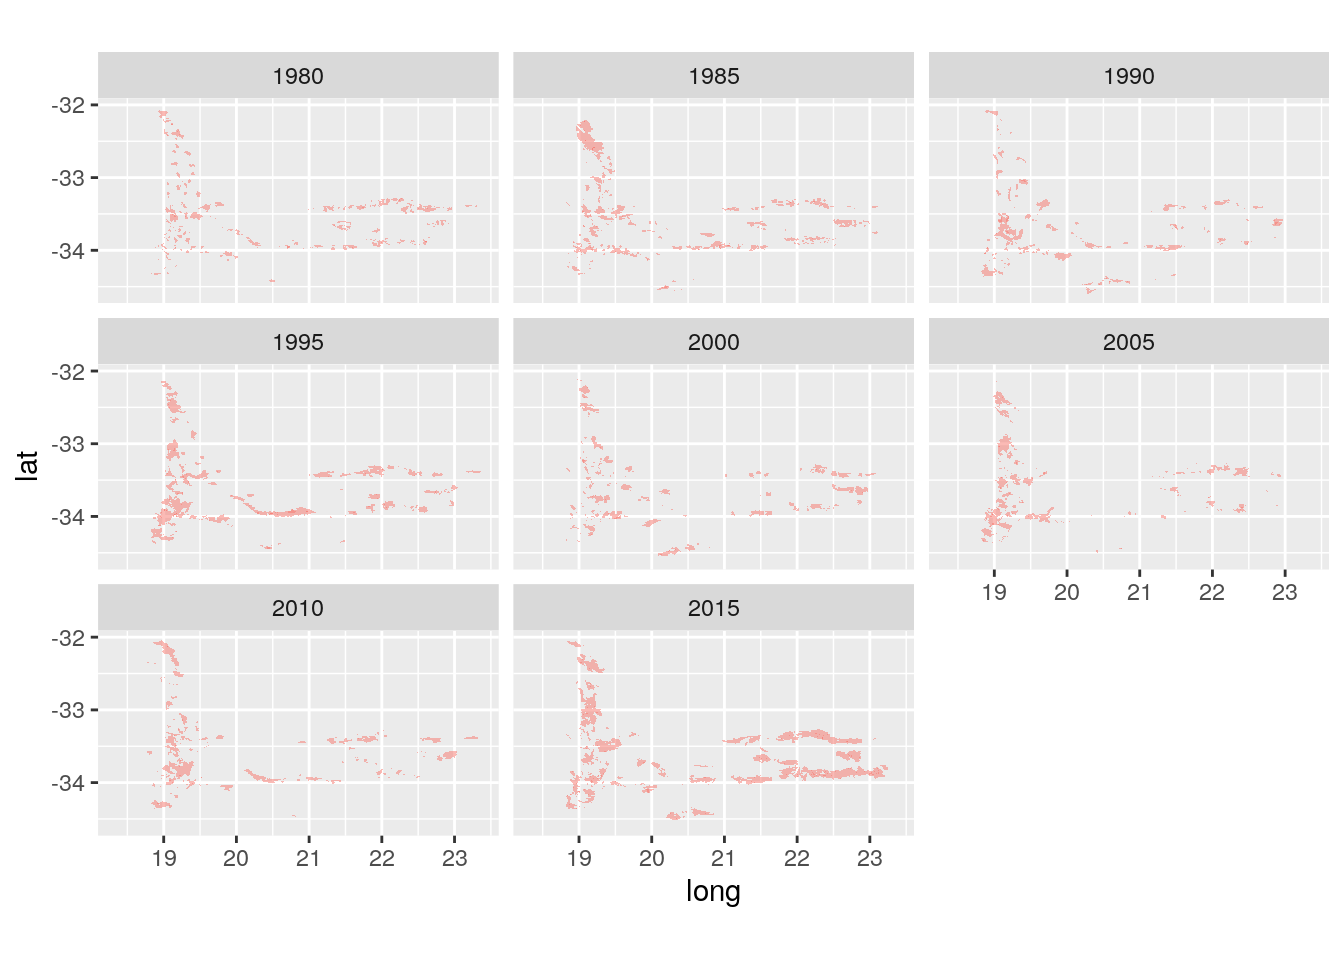
Oh, and if you were wondering if the fires are relatively uniform in space, here’s the map by decade :)
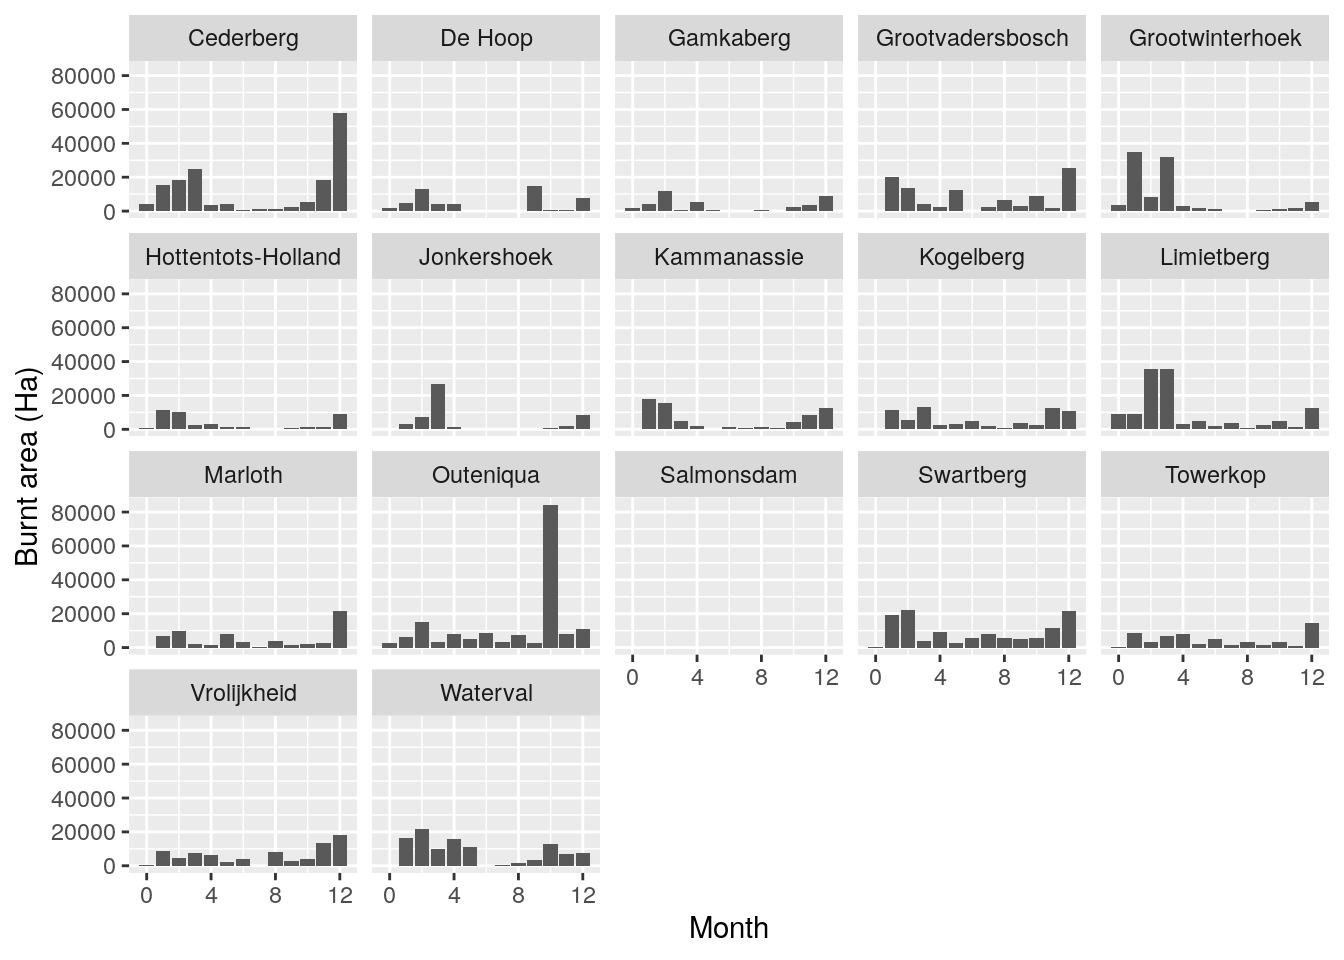
And the area burnt by month for each region. Note that “0” indicates fires where the date isn’t known.