Points, lines, polygons and rasters - R can handle them all. My aim for this post is to give you the basics required to teach yourself spatial data analysis in R - following 3 major sections listed above.
In the next post I provide a practical example working with point, line, polygon and raster data. If you’re already familiar with R then you can skip straight there, but you may be interested to check out the useful DIY resources before you go.
If you’ve been using my old “Primer for Handling Spatial Data in R” post note that this is just an update, but I’ve decided to split it into a series of independent posts to make it less unwieldy and allow me to expand it in future - my apologies if you prefered the old scheme…
Installing R (and RStudio)
You can download R for Windows, Mac or Linux from The Comprehensive R Archive Network (CRAN) and install.
Base R can be quite clunky to deal with, so there is a range of additional software packages designed to help you manage your R code, plots, projects etc. One of the better ones (i.e. the one that I use and I’m clearly not bias) is RStudio. You want to download the Open Source version of RStudio Desktop. When you open RStudio after installing you’ll see that it has opened R in the “Console” window.
Note that the base version of R is as small as possible, trimmed down to only the essential functions etc. More advanced and user specific functions are available as “Contributed Extension Packages” or “libraries”. You can access the list of packages from https://cran.r-project.org/. At the time of writing there were almost 13 000 packages and growing!!! This can be quite bewildering if you’re not sure what you need, but fortunately there are…
CRAN Spatial Task Views!!!
Some great fellas have taken the time to sift through all the R libraries and make some sense of them for different focal topics and created “Task Views”. Fortunately for us there’s a Spatial Task View maintained by Roger Bivand. There’s also a SpatioTemporal Task View maintained by Edzer Pebesma, which overlaps somewhat, but specifically focuses on data where both location and time of observation are registered, and relevant for the analysis of the data.
Each Task View has a landing page with an overview highlighting what you can do with the different packages and their respective strengths, weaknesses etc., e.g.
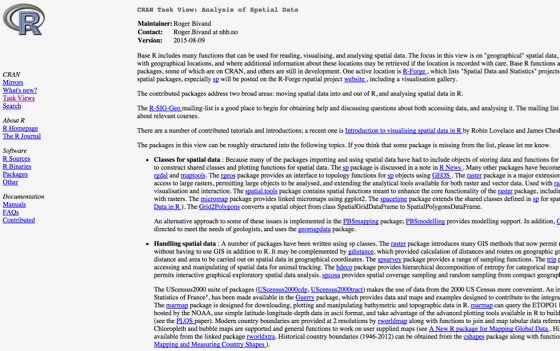
Topics covered by the Spatial Task View, which focuses on “Analysis of Spatial Data”:
- Classes for spatial data
- Handling spatial data
- Reading and writing spatial data
- Reading and writing spatial data - other packages
- Visualisation
- Point pattern analysis
- Geostatistics
- Disease mapping and areal data analysis
- Spatial regression
- Ecological analysis
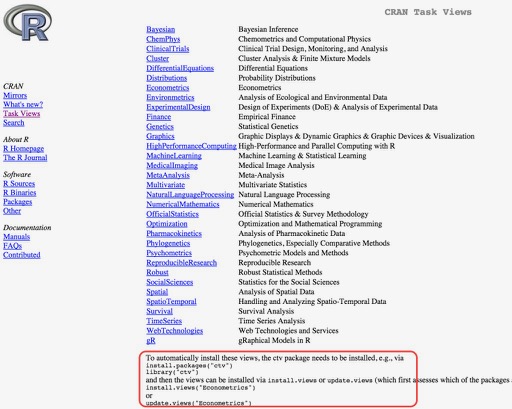
Task Views also allow easy download and installation of all packages in a Task View using library(ctv) - see highlighted code below. But beware! It can take a while to download and install if it is a big Task View and the the Spatial one is BIG!!! You don’t need the whole Task View for my tutorials, so don’t bother downloading it if you’re just working through these.
Useful DIY resources
- The Analysis of Spatial Data Task View!
- http://robinlovelace.net/ especially his new online book Geocomputation with R
- https://www.nceas.ucsb.edu/scicomp/solutions
- https://statnmap.com/
- http://pakillo.github.io/R-GIS-tutorial/
- http://spatial.ly/ - For some visual R inspiration!
- http://www.googleityoumoron.com - There are plenty of resources!!!
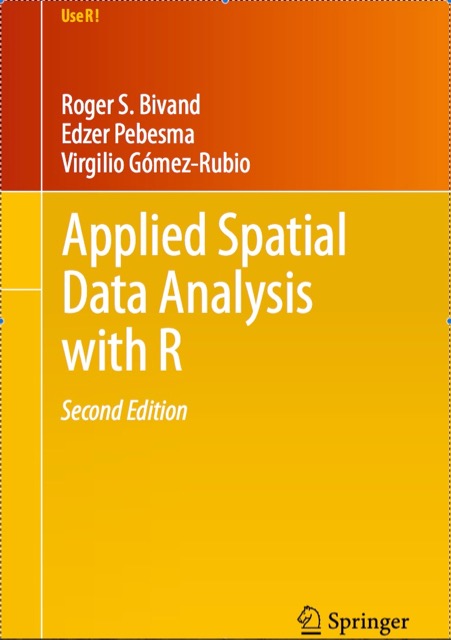
I’d also highly recommend Applied Spatial Data Analysis with R by Roger Bivand et al. (2013) - While the R packages available change every day, this is still a great intro to handling spatial data and a great resource for getting deeper into the statistics!
Move on to the next post, which provides a practical example working with point, line, polygon and raster data?