This is based on data collected when I took students from SAEON’s Graduate Student Network into the field to introduce them to Fynbos and to show them a bit of the science I’m working on. To make things more interesting, I got them to help me test a smartphone app I’ve been developing (“VeldWatch”) that can be used to map any impacts on natural ecosystems observed in the field, like invasive species, plant mortality, etc.
The aim behind developing VeldWatch is to provide a platform whereby citizen scientists can contribute these observations, but also help groundtruth a model I’ve been working on (with others!) that identifies anomalous changes in vegetation greenness using satellite data.
If that’s not setting the bar high enough, I thought I’d use this blog post to both show them the results of our field trip (and the implications for the spatial accuracy of the App…) and provide a little tutorial on mapping in R. Here goes…
We’ll start by calling the R libraries we need. If you don’t have the necessary packages installed use the function install.packages() as below.
#install.packages("googlesheets") #Don't forget the the ""!
library(googlesheets)
suppressMessages(library(dplyr))
suppressMessages(library(tidyr))
suppressMessages(library(raster))
suppressMessages(library(rgdal))
suppressMessages(library(RColorBrewer))
suppressMessages(library(leaflet))
suppressPackageStartupMessages(library(ggmap))
The VeldWatch App uploads the observation data directly into a Google Sheet in my GDrive (and the labeled photos into a folder), so it’s easiest if we can call the data directly from the online sheet rather than manually sharing and downloading the sheet every time. To do this, I use library(googlesheets) developed by Jenny Bryan and Joanna Zhao. Check out their tutorial for more of the basics.
I’ve shared the sheet publically so you should just be able to access it, but you may get asked to authenticate R accessing your Google Sheets the first time you use this code. If googlesheets doesn’t work for you, you can access the spreadsheet here, download as .xlsx or .csv and read into R as you normally would.
Here we extract the google sheet key from the shared URL link, “register the key” (needed for accessing the spreadsheet), download the data and take a quick look at it.
key <- extract_key_from_url("https://docs.google.com/spreadsheets/d/1dDOo-nizXC1XDECPkXts2VloDaObTuNwxPBhYJFNLdo/edit?usp=sharing") #extract the google sheet key from a shared URL

dat <- key %>% gs_key(verbose = FALSE) %>% gs_read(ws=1, verbose = FALSE) #register the key and download the data in the first worksheet

dat
## # A tibble: 36 x 21
## TimeStamp `Radius assesse… `Land cover` Impact `Alien grass de…
## <drtn> <chr> <chr> <chr> <chr>
## 1 10:05 15m Natural No ob… <NA>
## 2 10:39 15m Natural Alien… <NA>
## 3 10:41 15m Natural Recen… <NA>
## 4 10:44 15m Natural Alien… <NA>
## 5 09:03 100m Near natural Dead … <NA>
## 6 10:41 15m Natural Dead … <NA>
## 7 08:33 100m Near natural Veget… <NA>
## 8 08:34 100m Near natural Veget… <NA>
## 9 08:42 5m Near natural Alien… Individuals com…
## 10 08:49 100m Near natural Veget… <NA>
## # … with 26 more rows, and 16 more variables: `No of alien plants in
## # search radius` <chr>, `Clearing intensity` <lgl>, `No of dead plants
## # in search radius` <chr>, `Size of land/rock slide` <lgl>, `Vegetation
## # removal` <chr>, `Suggested species or common name` <chr>,
## # Comment <chr>, `Phone location` <chr>, `Photo A` <chr>, `Photo
## # B` <chr>, `Photo C` <chr>, `Photo D` <chr>, Geolocation <chr>,
## # Date <chr>, Time <drtn>, Test <lgl>Now we want to extract the latitude and longitude stored in the “Geolocation” column into separate columns. This requires splitting the value in each row of “Geolocation” by the fixed divider “,” and assigning the first value from each split to latitude and the second to longitude. We’ll use the function separate() from library(tidyr) to do this.
dat <- dat %>% separate(Geolocation, sep = ", ", c("Lat", "Lon"), remove = FALSE, convert = TRUE)This has added new columns “Lat” and “Lon”. Setting “remove = FALSE” keeps the column “Geolocation”, while “convert = TRUE” coerces the new columns to class “numeric” from “character” if possible.
We can then make the data frame a spatial object of class “SpatialPointsDataFrame” using the function coordinates(). This is essentially like converting the table to a shapefile with point locations and an attribute table.
class(dat)## [1] "tbl_df" "tbl" "data.frame"sdat <- dat #Make a new data frame "sdat" that we'll convert to a spatial object
coordinates(sdat) <- ~Lon+Lat
class(sdat)## [1] "SpatialPointsDataFrame"
## attr(,"package")
## [1] "sp"Note that if we are working with spatial data we need to assign a coordinate reference system (CRS). In this case the coordinates are geographic (unprojected) with the geodetic datum WGS84. We can tell R this by assigning a “proj4string”. I’m not going to go into the details of CRSs, but they differ in terms of whether they represent locations, distances or areas correctly, and can differ depending on where you are on the planet. You need to choose the correct CRS for the analysis you are doing. You can read more about them here. In all cases, you want to make sure that all your spatial objects have the same CRS!!!
proj4string(sdat) <- "+proj=longlat +datum=WGS84 +no_defs +ellps=WGS84 +towgs84=0,0,0"Note that this merely assigns a CRS, it does not transform the data from one CRS to another. If you don’t know the original CRS your data are in they are useless for spatial analyses until you find out…
Ok, let’s see where our points land…
b <- bbox(extent(sdat)+.25)

smap <- ggmap(get_map(location = b, source = "stamen", maptype = "watercolor",
    crop = T, zoom = 11))

smap + geom_point(data = dat, aes(x = Lon, y = Lat, col = "red2"), alpha = 1)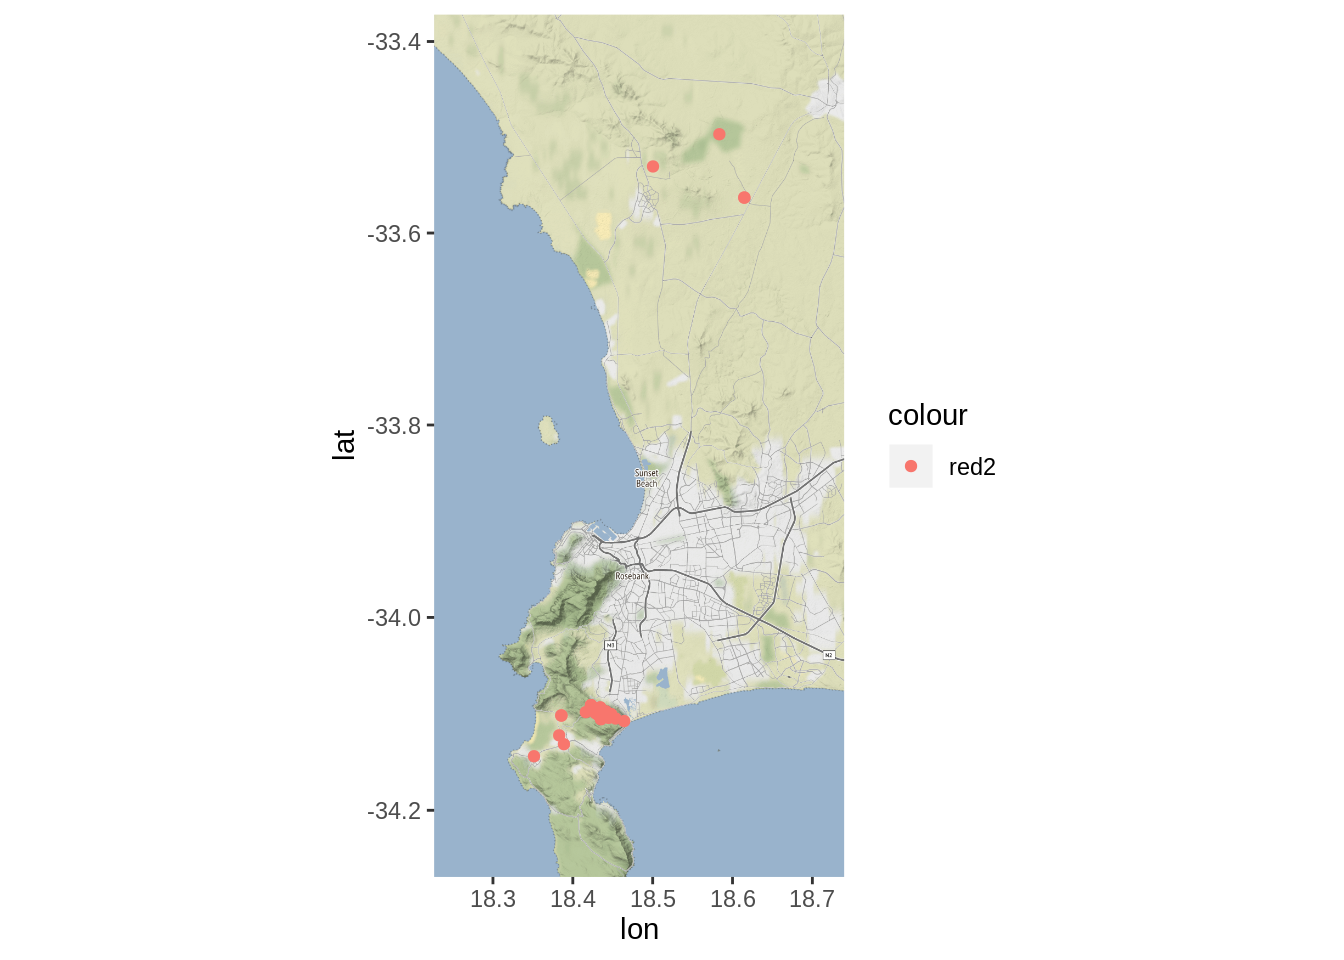
Looks like we have points all over the place, but this is not unexpected - ideally people will be using the app to collect data from across the country!
We can trim the records to our area of interest by setting our desired extent and cropping the data.
fdat <- crop(sdat, y = extent(18.38, 18.51, -34.15, -34.06)) #crop points to extent

fb <- bbox(extent(fdat)+.125)
fmap <- ggmap(get_map(location = fb, source = "stamen", maptype = "watercolor",
    crop = T, zoom = 11))
fmap + geom_point(data = dat, aes(x = Lon, y = Lat, col = "red2"), alpha = 1)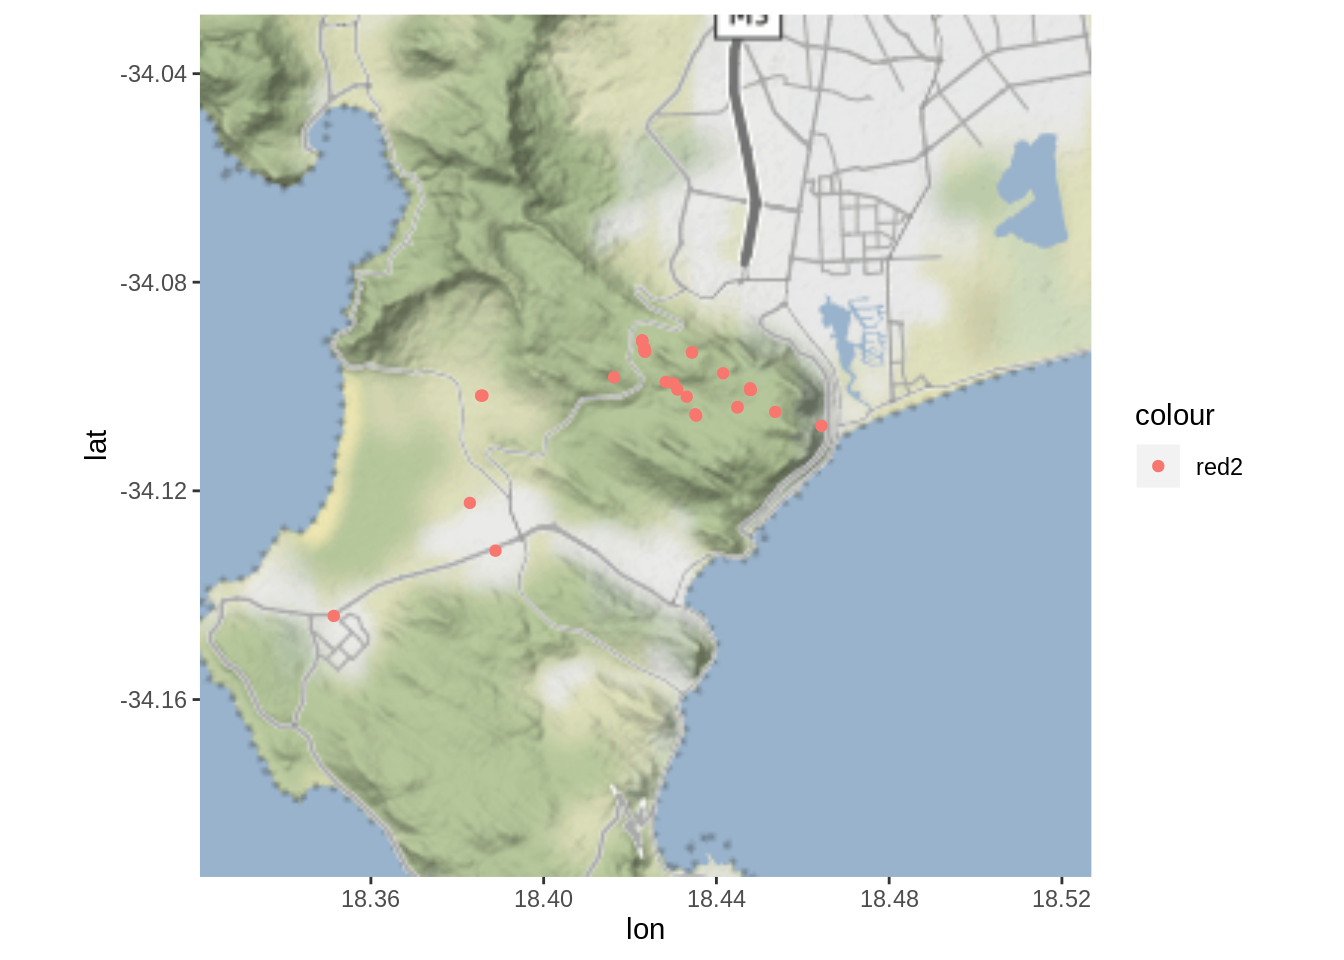
Much better!
BUT! Some of the points we logged with the app are FAR from where we were hiking?
Let’s add a GPS track I took to see where we actually were. You can download the track here.
track <- readOGR(dsn="/home/jasper/Dropbox/SAEON/GSN/2017/Track_14-SEP-17 164823.gpx", layer="tracks")## OGR data source with driver: GPX
## Source: "/home/jasper/Dropbox/SAEON/GSN/2017/Track_14-SEP-17 164823.gpx", layer: "tracks"
## with 1 features
## It has 13 fieldsNow let’s add the track to our plot, but to do this with the plotting functions we’ve been using we need to use the function fortify() to arrange the track properly.
track_f <- fortify(track)

head(track_f)
## long lat order piece id group
## 1 18.42222 -34.09084 1 1 0 0.1
## 2 18.42232 -34.09088 2 1 0 0.1
## 3 18.42241 -34.09093 3 1 0 0.1
## 4 18.42250 -34.09099 4 1 0 0.1
## 5 18.42259 -34.09106 5 1 0 0.1
## 6 18.42267 -34.09111 6 1 0 0.1Now we can just add it to our existing plot with geom_path().
fmap + geom_point(data = dat, aes(x = Lon, y = Lat, col = "red2"), alpha = 1) +
  geom_path(data = track_f, aes(x=long, y=lat, group=group, col = "royalblue"))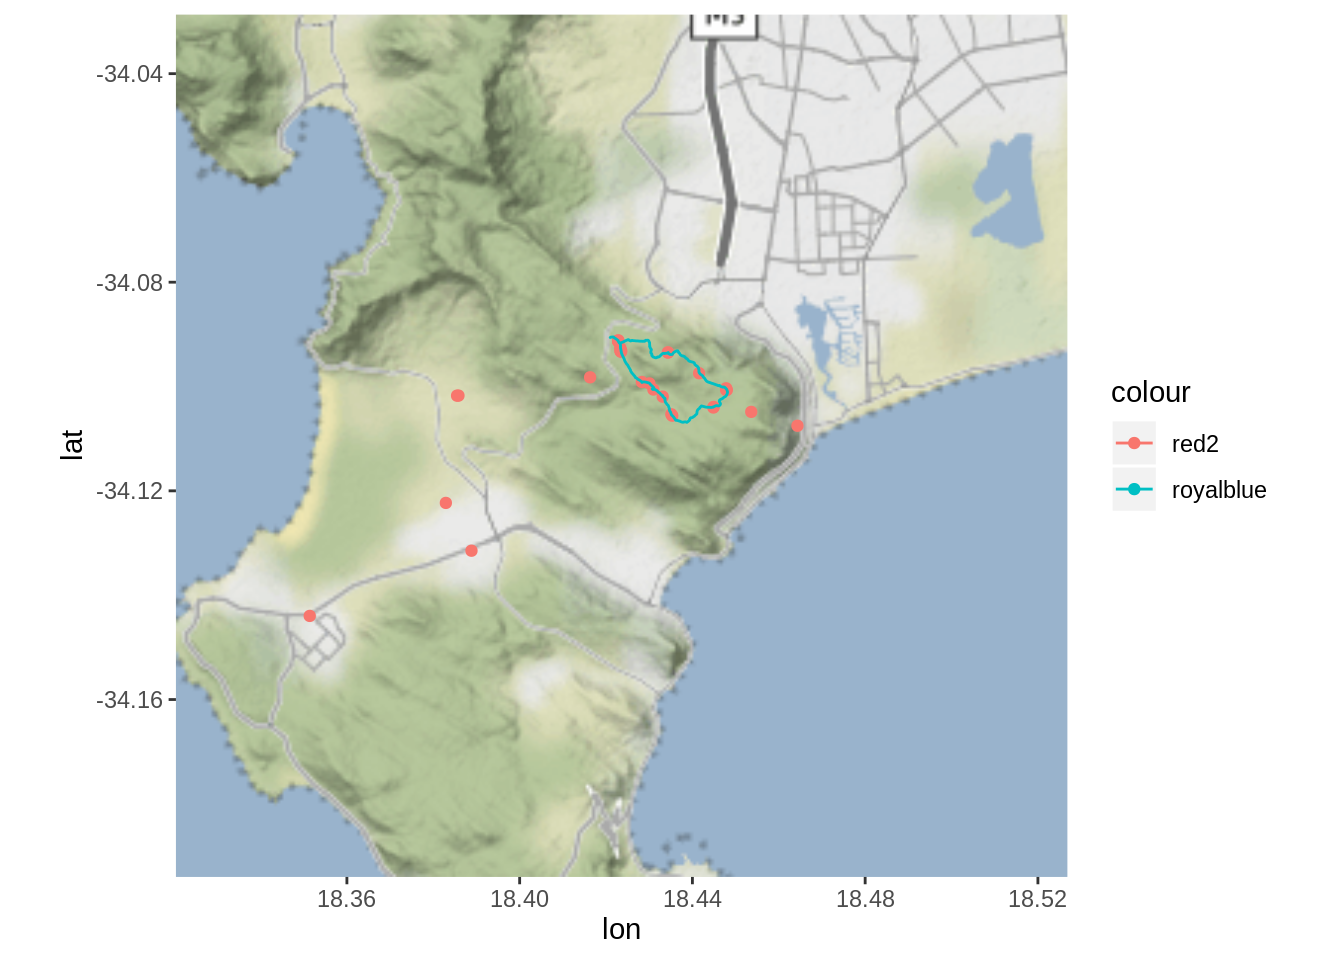
Oh dear…
Another “oh dear” is that it’s my 6-month old’s bath time, so I’ll have to stop here and come back to this. My plan is to identify the “errant” points by calculating the distance to the GPS track, and then see if it’s the same phone.
But first, let’s look at some of the data interactively!
fdat@data <- fdat@data %>% separate(Geolocation, sep = ", ", c("Lat", "Lon"), remove = FALSE, convert = TRUE)
leaflet(fdat) %>% addProviderTiles(providers$Esri.WorldImagery) %>% addMarkers(~Lon, ~Lat)
I need to add a bunch more context etc here, but for my and the students’ sake we’d like to visualize the model outputs. First lets look at the sites that are less green than the model expects.
excbelow <- raster("/home/jasper/Dropbox/Shared/Data4ClimateAction/PeninsulaData/exceedbelow")

pal <- colorNumeric(brewer.pal(9, "Reds"), values(excbelow), na.color = "transparent")

leaflet()  %>% addProviderTiles(providers$Esri.WorldImagery) %>%
  addRasterImage(excbelow, colors = pal, opacity = 0.5) %>%
  addLegend(pal = pal, values = values(excbelow),
    title = "Exceedance Below")
Now the sites that are more green than expected…
excabove <- raster("/home/jasper/Dropbox/Shared/Data4ClimateAction/PeninsulaData/exceedabove")

pal <- colorNumeric(brewer.pal(9, "Blues"), values(excabove), na.color = "transparent")

leaflet()  %>% addProviderTiles(providers$Esri.WorldImagery) %>%
  addRasterImage(excabove, colors = pal, opacity = 0.5) %>%
  addLegend(pal = pal, values = values(excabove),
    title = "Exceedance Above")
You’ll note that some sites are both above and below! These sites are just inherantly noisy. I still need to figure out why! One more item on the never-ending ToDo list!