4 GIS data models and file formats
4.1 Data models
GIS data typically come in two data model types vector or raster.
4.1.1 Vector data
The three basic vector data types are points, lines (also sometimes referred to as polylines or linestrings) and polygons. While they are treated as different data types, you can also consider them to be a nested hierarchy. For example, to make a line you need two or more points, while a polygon requires three or more lines.
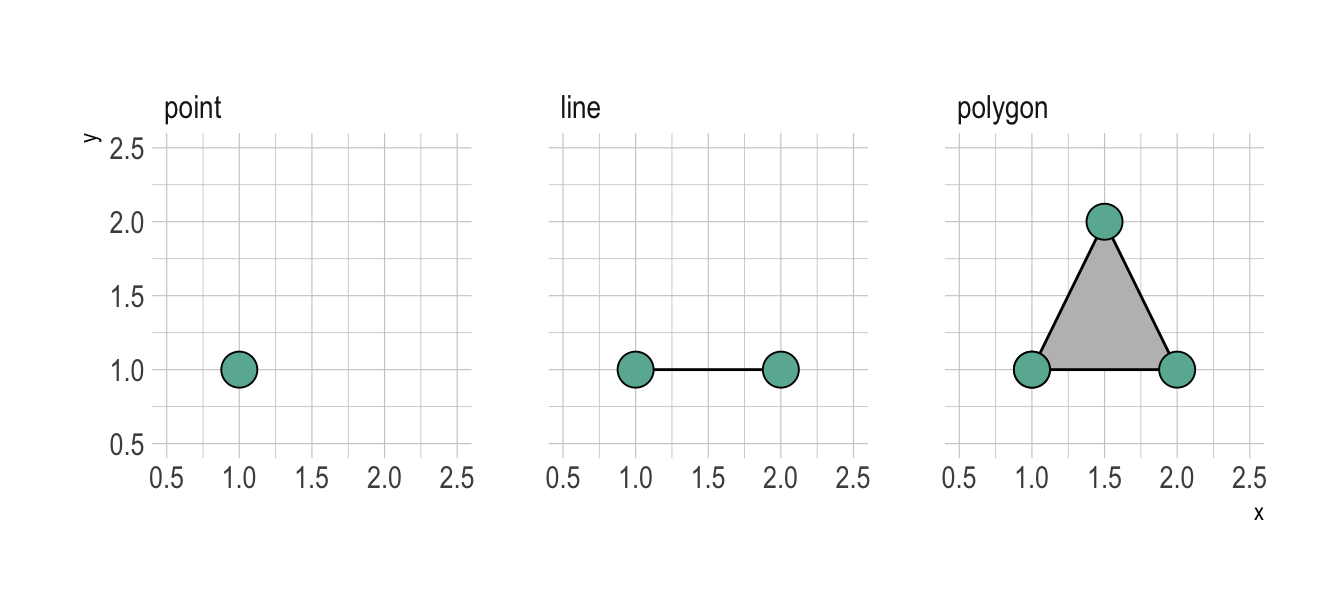
Figure 4.1: The hierarchical construction of vector data types.
From this we can observe the different properties of the data types:
- a point is a location in space defined by a set of coordinates based on a coordinate reference system (more about these later)
- a line is two or more points with straight lines connecting them, where each line has a length
- a polygon is a set of points connected by lines that form a closed shape, which has an area
Note that these “data types” are also commonly called feature classes, geometric primitives or geometries. Later we’ll see that you get more complicated “types”, but these are generally combinations of the above: multipoint, multilinestring, multipolygon, geometry collection, etc and are largely just different data classes designed to help with handling data than unique geometries.
Vector data models are obviously the best way to represent points and lines. Polygons are usually the best way to represent discrete (categorical) data, especially where they may have complex boundaries.
For example:
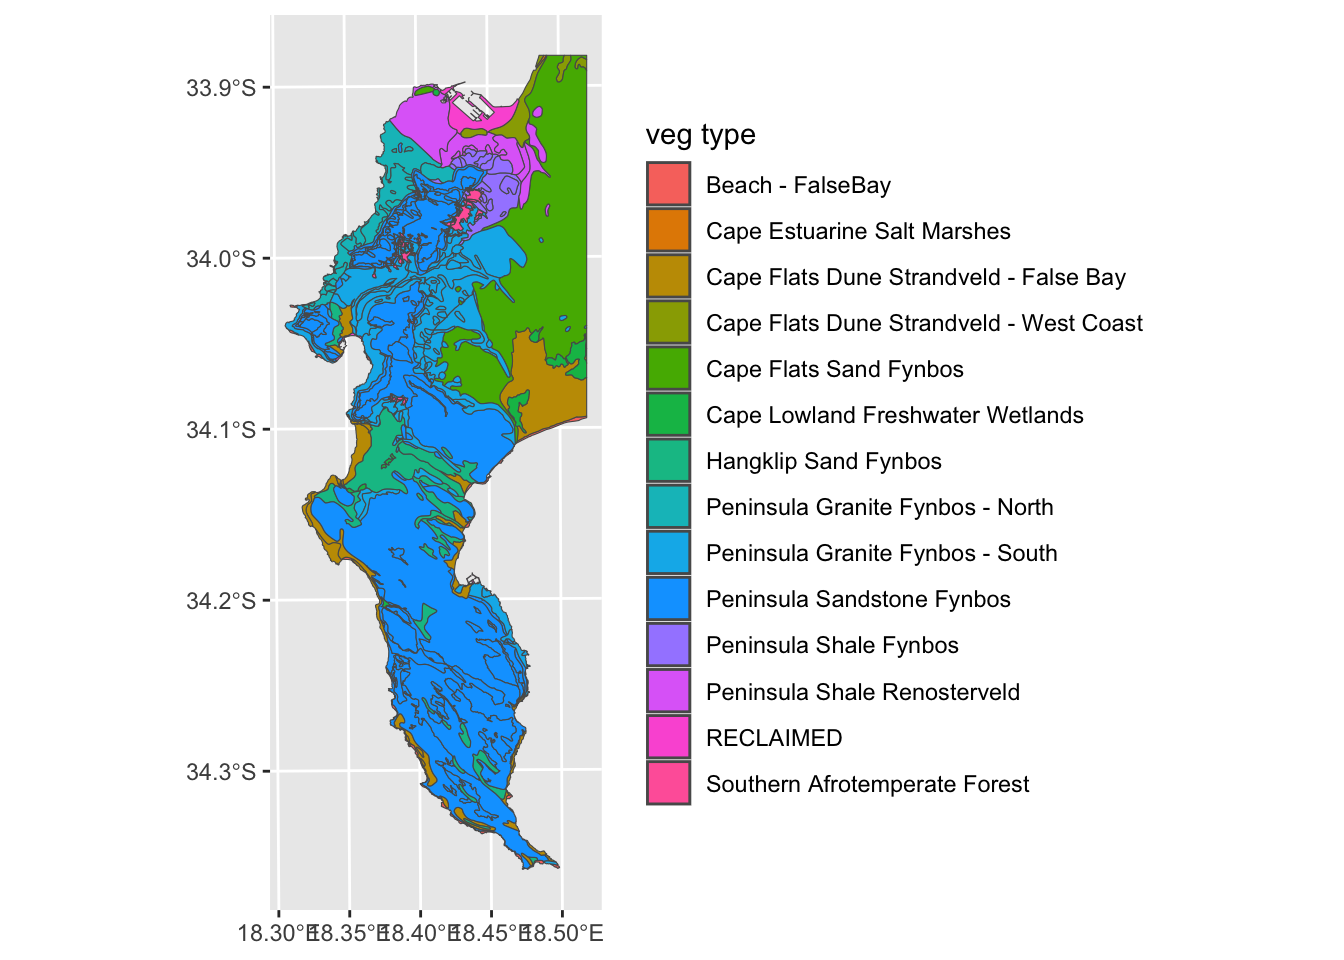
Figure 4.2: Vector (polygon) representation of discrete data; the vegetation types of the Cape Peninsula.
Vector data models are less good for representing continuous data (e.g. elevation, see surface temperature, etc). See further down.
4.1.2 Raster data
Raster data are essentially data stored in a regular grid of pixels (or cells). Digital images like jpeg or png files are essentially rasters without spatial information. The value of each pixel is a number representing a measured value (e.g. continuous data such as sea surface temperature) or a category (e.g. discrete data such as land cover class). All pixels have a value, even if the value is “No Data”.
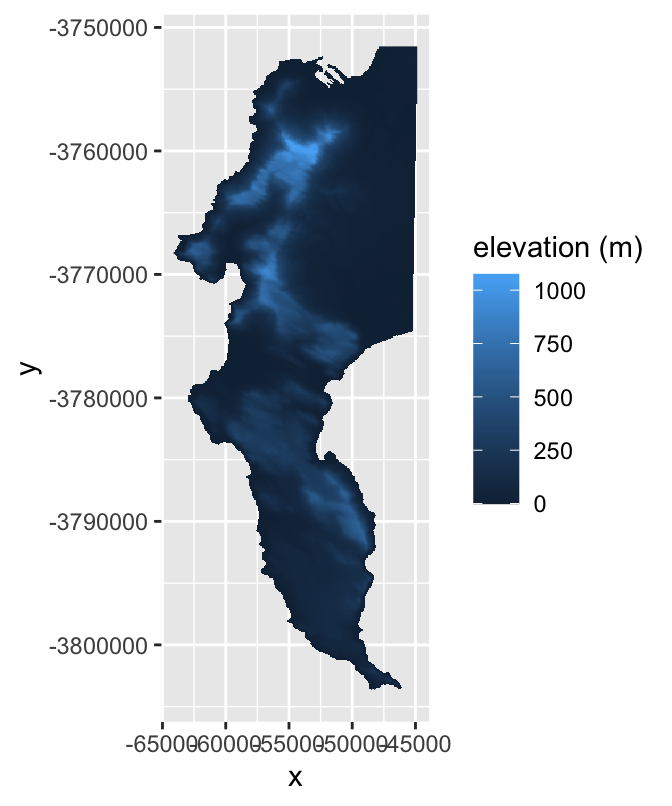
Figure 4.3: Raster representation of continuous data; a digital elevation model of the Cape Peninsula.
Rasters are particularly useful for representing continuous data. If this was a vector plot of the raw data, each pixel would have to be its own polygon and the legend would have a separate entry for each unique value, >60 000 entries!!!
That said, you can quite effectively represent continuous values visually with a vector data model if you bin the continuous data (from the raster) into classes, such as one can do with a filled contour plot (see below). This is not ideal for analyses though, as the binning results in data loss.
- You’ll find that you often need to convert data between vector and raster models for various reasons, and that this usually means some tough decisions need to be made about what is acceptable data loss. We’ll cover that later.
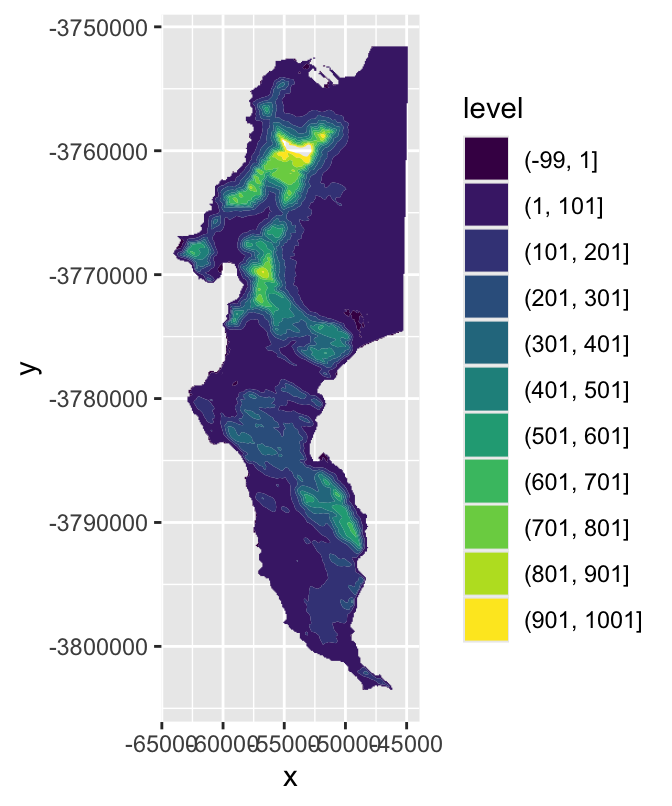
Figure 4.4: Vector representation of continuous data; a filled contour plot of a digital elevation model of the Cape Peninsula using 100m contours.
Conversely, rasters are usually not that good at representing categorical data. Note that most (but not all) raster file formats can only store numeric data, so this plot misleadingly represents the vegetation types as continuous data, but actually the numbers should link to the names of the veg types. You can label and represent categorical data in rasters in R, but this is usually more effort than its worth and is almost always less effective than using a vector format… A common exception is land use and land cover (LULC) maps, where remotely sensed satellite imagery (raster data) are classified into predefined classes (e.g. agriculture, rock, grassland, etc) based on various criteria or algorithms. Even then, these are difficult to interpret visually with static maps and are best visualized as interactive maps so you can make sense of them by zooming in and panning around.
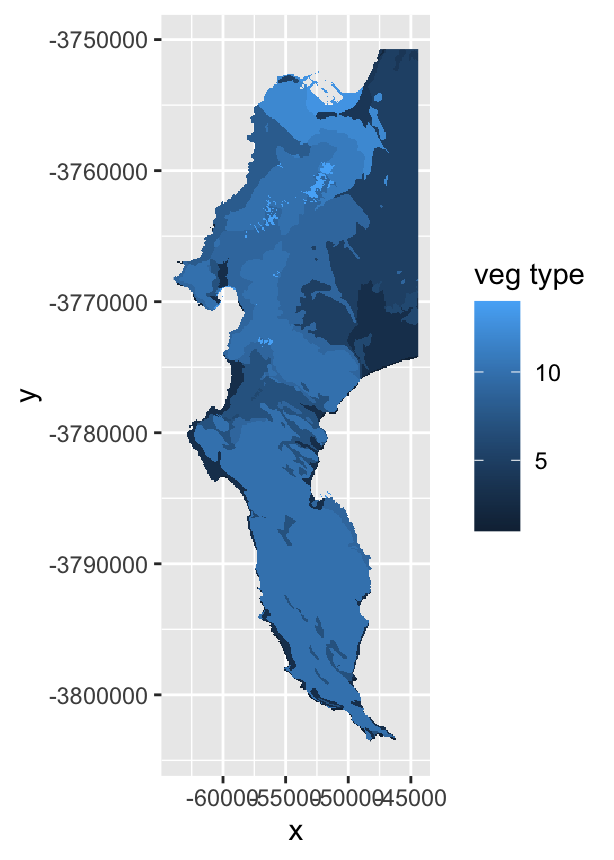
Figure 4.5: Raster representation the discrete data; the vegetation types of the Cape Peninsula.
4.2 Attribute data
Attributes are what we know about the objects represented in a layer in addition to their geometry - i.e. each spatial object usually has additional information associated with it. These data are usually stored in an associated Attribute Table.
Here are the first few entries of the attribute table for our Cape Peninsula vegetation vector layer:
| AREA_HCTR | PRMT_MTR | veg type | Subtype | Community | geometry | |
|---|---|---|---|---|---|---|
| 66 | 6.774255 | 1596.83494 | Beach - FalseBay | BEACH | Need to Find Out | POLYGON ((-46636.54 -380320… |
| 67 | 14.151168 | 3886.68578 | Beach - FalseBay | BEACH | Need to Find Out | POLYGON ((-47220.45 -380302… |
| 68 | 8.575597 | 2154.00714 | Beach - FalseBay | BEACH | Need to Find Out | POLYGON ((-48967.57 -380253… |
| 69 | 0.000001 | 23.25575 | Beach - FalseBay | BEACH | Need to Find Out | POLYGON ((-49355.61 -380223… |
| 70 | 5.333203 | 3589.09436 | Beach - FalseBay | BEACH | Need to Find Out | POLYGON ((-50008.26 -380132… |
| 71 | 24.448116 | 7378.70451 | Beach - FalseBay | BEACH | Need to Find Out | POLYGON ((-52927.7 -3800156… |
Note that vector data generally have attribute tables, but they are rare for raster layers, because most raster file formats can store just one attribute per cell (e.g. elevation) and can’t have associated attribute tables.
A handy feature of most GIS systems is that they can treat attribute tables like relational database table structures. Additional information can be joined onto your spatial data by joining two tables with a common key field, as one does when joining two tables of non-spatial data. In GIS, this is called an “Attribute Join”, because you have joined the tables by attribute and haven’t used spatial information (also sometimes called a “non-spatial join”). We’ll learn about “spatial joins” later…
WARNING! The values in attribute tables are typically static and are not recalculated every time you alter the feature of interest. For example, you can crop the Cape Peninsula vegetation layer, but the values in the AREA_HCTR (area) and PRMT_MTR (perimeter) columns of the attribute table will not change, even if the polygons in question are now smaller!
4.3 File formats
Linked to data models, and attributes, is file formats. Generally, there are separate file formats for vector vs raster data. Usually, we even have separate files for the different types of vectors (points, lines, polygons, etc), but this is changing as new “database” formats evolve.
There is a huge variety of GIS file formats, which have proliferated as different software packages have developed their own set of “native” formats. Each of these have different properties in terms of the data they store, whether they can include attribute data, file size and compression, and of course how they actually store (and retrieve) the data. Many of these, like the ESRI formats, are proprietary (i.e. not open source).
If you’ve done any GIS before, you’ll be familiar with ESRI shapefiles, which usually include a group of 3 or more files with the same name, but a different file extension. Each file stores different information. The most common ones are:
- .shp = the main feature geometry
- .shx = an index file, used for searching etc
- .dbf = stores the attribute information
- .prj = stores the coordinate reference system
- etc = there are many other optional files that may be present depending on the data stored
Shapefiles are by far the most common format for vector data. For raster data, the most common format is probably GeoTIFF (.tif) or ASCII (.asc).
You can view the lists of most of the file types supported by R (or rather the GDAL software that underlies most of R’s spatial data capabilities) by running the code sf::st_drivers() which gives this output:
| name | long_name | write | copy | is_raster | is_vector | vsi | |
|---|---|---|---|---|---|---|---|
| ESRIC | ESRIC | Esri Compact Cache | FALSE | FALSE | TRUE | TRUE | TRUE |
| PCIDSK | PCIDSK | PCIDSK Database File | TRUE | FALSE | TRUE | TRUE | TRUE |
| netCDF | netCDF | Network Common Data Format | TRUE | TRUE | TRUE | TRUE | FALSE |
| PDS4 | PDS4 | NASA Planetary Data System 4 | TRUE | TRUE | TRUE | TRUE | TRUE |
| VICAR | VICAR | MIPL VICAR file | TRUE | TRUE | TRUE | TRUE | TRUE |
| JP2OpenJPEG | JP2OpenJPEG | JPEG-2000 driver based on OpenJPEG library | FALSE | TRUE | TRUE | TRUE | TRUE |
| Geospatial PDF | TRUE | TRUE | TRUE | TRUE | FALSE | ||
| MBTiles | MBTiles | MBTiles | TRUE | TRUE | TRUE | TRUE | TRUE |
| BAG | BAG | Bathymetry Attributed Grid | TRUE | TRUE | TRUE | TRUE | TRUE |
| EEDA | EEDA | Earth Engine Data API | FALSE | FALSE | FALSE | TRUE | FALSE |
| OGCAPI | OGCAPI | OGCAPI | FALSE | FALSE | TRUE | TRUE | TRUE |
| ESRI Shapefile | ESRI Shapefile | ESRI Shapefile | TRUE | FALSE | FALSE | TRUE | TRUE |
| MapInfo File | MapInfo File | MapInfo File | TRUE | FALSE | FALSE | TRUE | TRUE |
| UK .NTF | UK .NTF | UK .NTF | FALSE | FALSE | FALSE | TRUE | TRUE |
| LVBAG | LVBAG | Kadaster LV BAG Extract 2.0 | FALSE | FALSE | FALSE | TRUE | TRUE |
| OGR_SDTS | OGR_SDTS | SDTS | FALSE | FALSE | FALSE | TRUE | TRUE |
| S57 | S57 | IHO S-57 (ENC) | TRUE | FALSE | FALSE | TRUE | TRUE |
| DGN | DGN | Microstation DGN | TRUE | FALSE | FALSE | TRUE | TRUE |
| OGR_VRT | OGR_VRT | VRT - Virtual Datasource | FALSE | FALSE | FALSE | TRUE | TRUE |
| Memory | Memory | Memory | TRUE | FALSE | FALSE | TRUE | FALSE |
| CSV | CSV | Comma Separated Value (.csv) | TRUE | FALSE | FALSE | TRUE | TRUE |
| GML | GML | Geography Markup Language (GML) | TRUE | FALSE | FALSE | TRUE | TRUE |
| GPX | GPX | GPX | TRUE | FALSE | FALSE | TRUE | TRUE |
| KML | KML | Keyhole Markup Language (KML) | TRUE | FALSE | FALSE | TRUE | TRUE |
| GeoJSON | GeoJSON | GeoJSON | TRUE | FALSE | FALSE | TRUE | TRUE |
| GeoJSONSeq | GeoJSONSeq | GeoJSON Sequence | TRUE | FALSE | FALSE | TRUE | TRUE |
| ESRIJSON | ESRIJSON | ESRIJSON | FALSE | FALSE | FALSE | TRUE | TRUE |
| TopoJSON | TopoJSON | TopoJSON | FALSE | FALSE | FALSE | TRUE | TRUE |
| OGR_GMT | OGR_GMT | GMT ASCII Vectors (.gmt) | TRUE | FALSE | FALSE | TRUE | TRUE |
| GPKG | GPKG | GeoPackage | TRUE | TRUE | TRUE | TRUE | TRUE |
| SQLite | SQLite | SQLite / Spatialite | TRUE | FALSE | FALSE | TRUE | TRUE |
| ODBC | ODBC | FALSE | FALSE | FALSE | TRUE | FALSE | |
| WAsP | WAsP | WAsP .map format | TRUE | FALSE | FALSE | TRUE | TRUE |
| PGeo | PGeo | ESRI Personal GeoDatabase | FALSE | FALSE | FALSE | TRUE | FALSE |
| MSSQLSpatial | MSSQLSpatial | Microsoft SQL Server Spatial Database | TRUE | FALSE | FALSE | TRUE | FALSE |
| PostgreSQL | PostgreSQL | PostgreSQL/PostGIS | TRUE | FALSE | FALSE | TRUE | FALSE |
| OpenFileGDB | OpenFileGDB | ESRI FileGDB | FALSE | FALSE | FALSE | TRUE | TRUE |
| DXF | DXF | AutoCAD DXF | TRUE | FALSE | FALSE | TRUE | TRUE |
| CAD | CAD | AutoCAD Driver | FALSE | FALSE | TRUE | TRUE | TRUE |
| FlatGeobuf | FlatGeobuf | FlatGeobuf | TRUE | FALSE | FALSE | TRUE | TRUE |
| Geoconcept | Geoconcept | Geoconcept | TRUE | FALSE | FALSE | TRUE | TRUE |
| GeoRSS | GeoRSS | GeoRSS | TRUE | FALSE | FALSE | TRUE | TRUE |
| VFK | VFK | Czech Cadastral Exchange Data Format | FALSE | FALSE | FALSE | TRUE | FALSE |
| PGDUMP | PGDUMP | PostgreSQL SQL dump | TRUE | FALSE | FALSE | TRUE | TRUE |
| OSM | OSM | OpenStreetMap XML and PBF | FALSE | FALSE | FALSE | TRUE | TRUE |
| GPSBabel | GPSBabel | GPSBabel | TRUE | FALSE | FALSE | TRUE | FALSE |
| OGR_PDS | OGR_PDS | Planetary Data Systems TABLE | FALSE | FALSE | FALSE | TRUE | TRUE |
| WFS | WFS | OGC WFS (Web Feature Service) | FALSE | FALSE | FALSE | TRUE | TRUE |
| OAPIF | OAPIF | OGC API - Features | FALSE | FALSE | FALSE | TRUE | FALSE |
| EDIGEO | EDIGEO | French EDIGEO exchange format | FALSE | FALSE | FALSE | TRUE | TRUE |
| SVG | SVG | Scalable Vector Graphics | FALSE | FALSE | FALSE | TRUE | TRUE |
| Idrisi | Idrisi | Idrisi Vector (.vct) | FALSE | FALSE | FALSE | TRUE | TRUE |
| XLS | XLS | MS Excel format | FALSE | FALSE | FALSE | TRUE | FALSE |
| ODS | ODS | Open Document/ LibreOffice / OpenOffice Spreadsheet | TRUE | FALSE | FALSE | TRUE | TRUE |
| XLSX | XLSX | MS Office Open XML spreadsheet | TRUE | FALSE | FALSE | TRUE | TRUE |
| Elasticsearch | Elasticsearch | Elastic Search | TRUE | FALSE | FALSE | TRUE | FALSE |
| Carto | Carto | Carto | TRUE | FALSE | FALSE | TRUE | FALSE |
| AmigoCloud | AmigoCloud | AmigoCloud | TRUE | FALSE | FALSE | TRUE | FALSE |
| SXF | SXF | Storage and eXchange Format | FALSE | FALSE | FALSE | TRUE | TRUE |
| Selafin | Selafin | Selafin | TRUE | FALSE | FALSE | TRUE | TRUE |
| JML | JML | OpenJUMP JML | TRUE | FALSE | FALSE | TRUE | TRUE |
| PLSCENES | PLSCENES | Planet Labs Scenes API | FALSE | FALSE | TRUE | TRUE | FALSE |
| CSW | CSW | OGC CSW (Catalog Service for the Web) | FALSE | FALSE | FALSE | TRUE | FALSE |
| VDV | VDV | VDV-451/VDV-452/INTREST Data Format | TRUE | FALSE | FALSE | TRUE | TRUE |
| MVT | MVT | Mapbox Vector Tiles | TRUE | FALSE | FALSE | TRUE | TRUE |
| NGW | NGW | NextGIS Web | TRUE | TRUE | TRUE | TRUE | FALSE |
| MapML | MapML | MapML | TRUE | FALSE | FALSE | TRUE | TRUE |
| TIGER | TIGER | U.S. Census TIGER/Line | FALSE | FALSE | FALSE | TRUE | TRUE |
| AVCBin | AVCBin | Arc/Info Binary Coverage | FALSE | FALSE | FALSE | TRUE | TRUE |
| AVCE00 | AVCE00 | Arc/Info E00 (ASCII) Coverage | FALSE | FALSE | FALSE | TRUE | TRUE |
| HTTP | HTTP | HTTP Fetching Wrapper | FALSE | FALSE | TRUE | TRUE | FALSE |
Note that you can specify the what = argument in the function to "vector" or "raster" if you want only the drivers specific to each.
In short, there’s lots!!! But note that there are others that are not supported in R. Perhaps the most common unsupported ones you’ll encounter are the ESRI geodatabases (.gdb and .mdb), which are designed for ArcGIS and are super efficient (in ArcGIS), but ESRI haven’t released the drivers, so they don’t work (or at least not properly) for most other GIS software…
Note that there has been a big push to develop a standardized set of open source, efficient and interoperable file formats. Some examples to watch:
- GeoPackage - SQLite database containers for storing vector, raster and attribute data in a compact and transferable format.
- GeoJSON - a geographic version of JSON (JavaScript Object Notation) for vector data, very commonly used for web apps etc.
- Cloud-optimized GeoTIFF - as the name suggests; a GeoTIFF-based format for optimally hosting and allowing querying and downloading of raster data on the cloud…
- Simple Features - an open, efficient and interoperable standard for vector data.